Turn Your Member Data Into Action

This isn’t new thinking: most organization know that data is the key to engaging people with content they value and messages that resonate. It’s why companies like Meta and Google want so much of it. But having data is not enough. The real value lies in how you use it.
Taking a data-driven approach can lead to improved outcomes for your organization and your members. It can help you deliver value and gain a competitive edge in your industry.
However, turning your data insights into actions isn’t always straightforward. It requires a clear understanding of both your organizational goals and current state, a plan of action, the right tools, and a culture that supports data-driven decision making.
In this article, we’ll share tips you can use to turn your data insights into strategies that drive engagement. We’ll also call out opportunities to automate parts of this process to save time and improve personalization!
The Importance of a Data-Driven Strategy
Your data empowers your organization to identify trends, anticipate changes, and act on what matters most to your constituents. Organizations can optimize resources, improve member satisfaction, and boost revenue by relying on data insights.
For example, you can monitor member behavior on your website, in reaction to your emails, on your online community, on your job board – basically anywhere your members, customers, or audience interact with you. Then you can take what you learn from that data and use it to inform programs or trigger communications.
Incorporating data analysis into your organization’s decision-making ensures that your actions are supported by factual information. This reduces risks associated with guesswork and makes the programs and content you create more engaging. Data-driven decision-making is also a catalyst for innovation, helping you identify new ideas.
To successfully use your data to drive actions, though, you have to align your organization’s data collection and analysis with your overall goals.

Key Steps to Turning Data Into Action
Implementing campaigns based on your member data is best done by taking a systematic approach. Taking the time to identify goals and make a plan upfront helps ensure that you successfully reach those goals without getting sidetracked.
To transform data into actionable strategies, consider the following steps:
- Choose Your Destination: Identify organizational goals.
- Know the Terrain: Understand the data and metrics needed.
- Map the Journey: Decide on calls-to-action, cadence, and content.
- Explore the Sights: Look for opportunities to expand your understanding.
- Always Keep Moving: Iterate, innovate, renovate, and build another one.
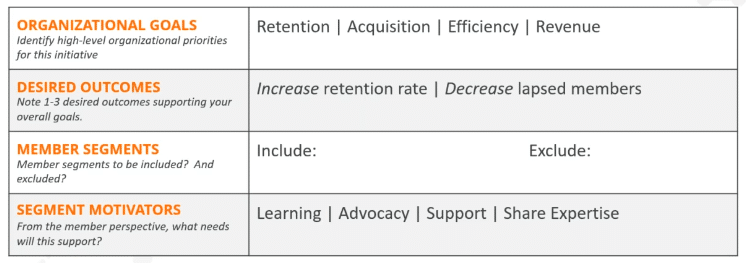
Choose Your Destination: Identify Goals
As you plan any data-driven campaign, first you want to identify and define the goals of the campaign. Essentially, why are you doing it? Think about the following:
- Organizational goals – Identify high-level priorities for the initiative.
- Desired outcomes – Outline 1-2 outcomes you’d like to achieve that support these overall goals.
- Member segments – Ask yourself who should be included and excluded from the campaign. Who is it most relevant for? Who is it designed to engage?
- Segment motivators – Understand the members’ side of things. What member needs does this initiative or campaign support? Put things in terms of what MEMBERS want, not what your organization wants.
Here’s a framework for what setting your goals might look like:
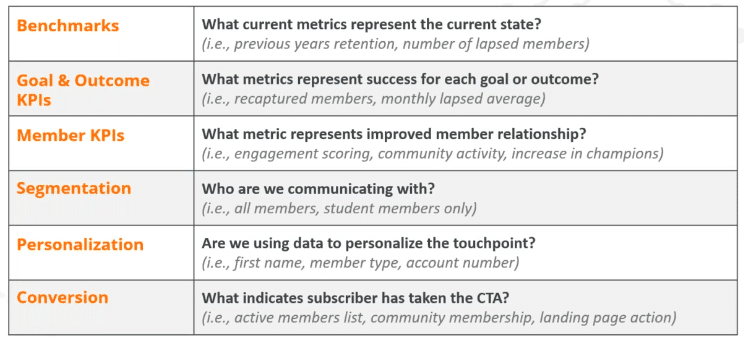
Know the Terrain: Understand Your Current Position and Necessary Data
I don’t know about you, but I don’t travel to places I haven’t been before without first doing a little research. When you’re about to embark on a new data-driven campaign, it helps to get the lay of the land first. Ask yourself what data and metrics you need to capture the CURRENT state and measure your success. Think about the following:
- Benchmarks – Which current metrics represent the current state?
- Goal and outcome KPIs – What metrics represent success for each goal or outcome?
- Member KPIs – What metrics represent improved member relationships?
- Segmentation – Who are we communicating with?
- Personalization – Are we using data to personalize each touchpoint?
- Conversion – What indicates a recipient has taken the action we wanted?
Here’s a framework for exploring what data you’ll need:
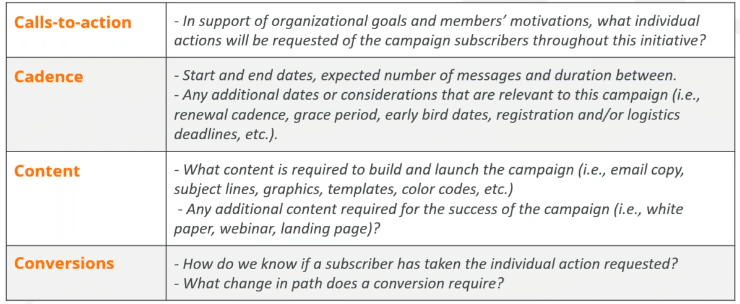
Map the journey: Make a Plan
Continuing the travel metaphor, you also probably can’t get somewhere you’ve never been before without some kind of plan or map. Similarly, as you continue to explore each step of your campaign, it’s helpful to outline how you’re going to put that campaign together, keeping your member segments and their motivators in mind. Think about the following:
- Calls to action – What are you asking the members to do? And are you putting the call to action in terms of what THEY need and what THEY will gain as opposed to what your organization wants?
- Cadence – How frequently and where are you communicating your message?
- Content – What is required to build the campaign?
- Conversions – Once you know someone has taken the action you want them to take, what change in their pathway needs to happen? (e.g. they stop getting messages in a campaign OR they get moved into something like a registrant campaign)
Here’s a framework for creating a plan:
Explore the Sights: Learn and Look for Opportunities
As you run your data-driven strategies and campaigns, it’s important to monitor their performance. See if different tweaks or changes improve engagement. And don’t forget to review ancillary data too – sometimes an initiative or campaign will teach you something you weren’t expecting. There may be opportunities to expand your understanding, better serve the members’ needs, and identify potential members of value. Look for the following:
- Organizational insights, behavioral insights, member activity, demographic data
- If someone isn’t engaging, see if what you sent doesn’t match their needs anymore and ask yourself if that opens another avenue (e.g. retired members who no longer renew membership but could maybe be added to a mentoring or planned giving campaign)
- What data points can you combine and review to gain deeper insights (web traffic, search, content downloads/usage, community activity)
- When you learn from what works, can you apply that to other campaigns to improve those too?
- Are there indicators that signal prospective members? (e.g. regular web visits or event participation)
- Are there indicators that signal members of value? (e.g. regular logins or activity in your online community)
- Can people’s behavior inform your understanding of what content offers the most value? (e.g. if you look not just at click rates but WHERE members are clicking in your newsletters, do any topics stand out?)
Always Keep Moving: Iterate and Innovate
Remember to use what you learn from each data-driven campaign to keep improving. Consider actually taking the time to write down your conversion rate for the campaign and compare the outcomes with your original goals and desired outcomes. This can help you evaluate how things went, if you stayed on track toward your goal, and where there’s room for improvement. Writing things down can also give you records to look back on when you run future campaigns
If something worked well, see if you can build on it. If something didn’t work well, consider the ways you can adjust and try something different. Even campaigns there a “failure” aren’t truly a failure because you learn something from them that can inform your future efforts.
Automate for Efficiency
As you work on different campaigns for different member segments, you should also consider opportunities to automate things. Not only does this help you save time, it also typically leads to better member engagement because you base communication and outreach on behavioral triggers. In other words, instead of blasting every email to everyone, people receive emails about things that align with their interests based on what they’re DOING.
Consider the following automation opportunities:
- One of the best places to start with marketing automation is your lifecycle campaigns, including your member renewal campaigns and lapsed member campaigns.
- Consider setting up campaigns based on web-tracking or engagement scoring, using your members activity on your website, in your emails, and on your online community to target them with highly relevant content.
- Higher Logic Thrive Marketing also comes with customizable, pre-built marketing automation campaigns to help you get started.
- Don’t forget to use your data to target and personalize engagement opportunities to members in your online community tool. Automation rules and gamification make it easy to set up triggers that can send your members reminders, add them to communities, celebrate them with badges, and more!
Also consider where one campaign might flow into the next. For example, when a member completes one course, maybe there’s a more advanced course they should do next. Or when someone registers for an event, they could be excluded from the event promotions and funneled into a registrant campaign.
Becoming More Data-Driven One Step at a Time
Different organizations are at different points in their journey toward becoming more data-driven. And it’s a journey that, honestly, is never done. Organizations should always be looking to their data to see what’s working now and what strategies need to be adjusted.
While the idea of constant adaptation and evolution might feel overwhelming, the good news is it’s never too late to start! No matter where you are in your data journey, there’s always an opportunity to ask yourself, “What else can I learn about my members? How can I use that to improve their experience? And how can I build the process efficiently to free up my time to keep looking into new ideas?”
You don’t have to have EVERY campaign set up at once. But, by using the process above, your organization can identify priorities and decide how to apply your data to address your most important organizational goals.
Related Resources

Member Data Success Kit
Your member data is one of your most valuable resources. Learn how to use it to improve the member experience...
Read More
Private: Association Success Series: Applying Analytics, Automation and AI
Date: February 21, 2025
Surveys show many leaders remain hesitant to embrace AI, analytics, and automation—three key technologies that are game-changers for staff and...
Watch Now
How do I… embrace automation?
Adopting automation can save hours of staff time – but it can sound like a big lift if you don’t...
Read MoreThis blog post was originally published in 2021 based on insights from our webinar series with Wicket and CSAE titled “Let’s Talk About Member Data.” It has since been updated for accuracy and relevancy.